

Key Market Trends
Sales activity remains well below last year’s level across most local markets in Loudoun County.
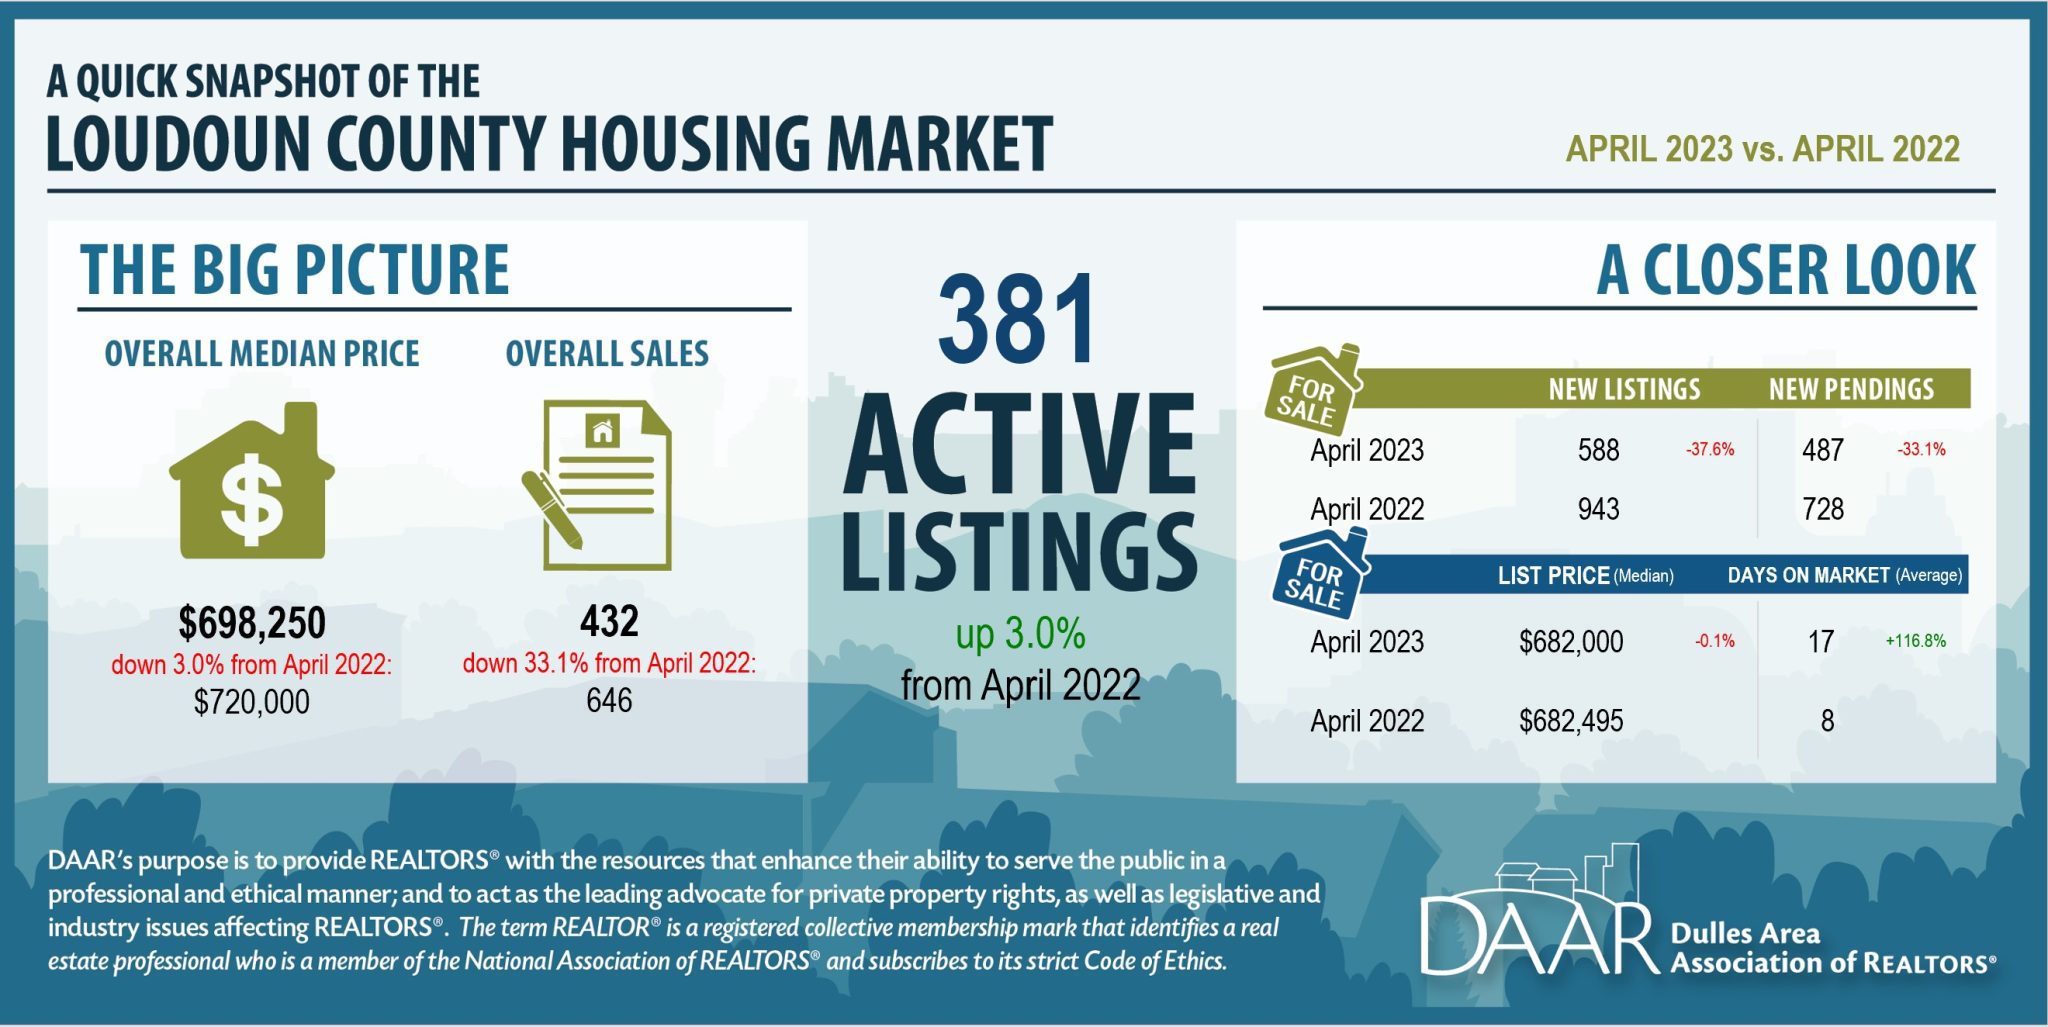
There were 432 sales countywide this month, 214 fewer sales than last April, a 33.1% drop off in activity. This is the slowest April market the county has had in more than a decade. Ashburn zip code 20148 had the biggest decrease in sales with 33 fewer sales than last year (-30.8%) while sales in Leesburg zip code 20176 declined by 21 sales (-29.2%). The only market where sales increased was Lovettsville 20180 with seven more sales than the previous year (+63.6%).
Pending sales cool, signaling a continuation of the slow spring market.
There were 487 pending sales in April in Loudoun County, 241 fewer pending sales than the same time a year ago, falling by 33.1%. Pending sales dipped the most in Ashburn zip code 20147 with 41 fewer pending sales (-34.2%) and Aldie zip code 20105 with 35 fewer pending sales than last year (-51.5%).
The median sales price in the Loudoun County housing market dipped from last April.
In April, the median sales price countywide was $698,250, a 3% decrease in price, which is $21,750 less than last year. This is only the second time in the last four years that the monthly median sales price was lower than the prior year. The sharpest price drops occurred in Lovettsville zip code 20180 down $135,000 from a year ago (-16.3%), Leesburg zip code 20175 (-12.2%) and Chantilly zip code 20152 (-11.1%). In Aldie zip code 20105, home prices were up $45,000 or 5.4%.
The number of active listings continues to build up in most parts of the county.
There were 381 active listings at the end of April in Loudoun County, 11 more listings than the year prior, a 3% increase. In Sterling zip code 20164 there were 13 more listings on the market than last year (+56.5%). Listings fell in Chantilly zip code 20152 with nine fewer listings than the previous year (-52.9%). The total number of new listings in Loudoun County plunged by 37.6% compared to last April.
Data Note: The housing market data for all jurisdictions in Virginia was re-benchmarked in November 2021. Please note that Market Indicator Reports released prior to November 2021 were produced using the prior data vintage and may not tie to reports that use the current data set for some metrics. We recommend using the current reports for historical comparative analysis.

Loudoun County Key Market Trends
March 2023
Sales activity continues to moderate in Loudoun County.
There were 376 sales in the county during the month of March, 203 fewer sales than last year, a 35.1% decrease. The markets where sales declined the most were in Ashburn zip code 20148 with 48 fewer sales (-49.5%) and Leesburg zip code 20176 down 28 sales from a year ago (-42.4%). Sterling zip code 20164 saw sales go up this month with 6 more sales than last March (+18.2%).
Pending sales activity continues to be sluggish.
In March, there were 461 pending sales across the county, 192 fewer pending sales than the previous year, a 29.4% drop off. Ashburn zip code 20148 had 29 fewer pending sales (-28.2%) and Chantilly zip code 20152 was down 24 pending sales from the year prior (-46.2%). Lovettsville zip code 20180 was the only local market in the county to have an uptick in pending sales this month (+50.0%), 6 additional pending sales compared to last March.
Home prices continue to climb in most local markets in the county.
The countywide median sales price in March was $720,000, up 5.9% from a year ago, an increase of $40,000. Median prices saw the biggest growth in Aldie zip code 20105 up $215,000 (+29.5%) and in Leesburg zip code 20176 with a gain of $187,500 from last year (+31.4%). The biggest price drops happened in Purcellville zip code 20132 (-11.3%) and Sterling zip code 20165 (-5.3%).
The number of active listings is building up in Loudoun County even as fewer new listings are coming on the market.
In the Loudoun County housing market, there were 355 active listings at the end of March, 98 more listings than a year ago, a 38.1% increase. Ashburn zip code 20147 experienced the sharpest rise in listings with 29 more listings (+131.8%) followed by Leesburg zip code 20176 with 26 additional listings (+136.8%). There were 627 new listings in March across the county, 211 fewer new listings than this time last year (-25.2%).
Data Note: The housing market data for all jurisdictions in Virginia was re-benchmarked in November 2021. Please note that Market Indicator Reports released prior to November 2021 were produced using the prior data vintage and may not tie to reports that use the current data set for some metrics. We recommend using the current reports for historical comparative analysis.
Sales slowed throughout Loudoun County in November.
In the county’s housing market, there were 329 sales in the month of November, down 48% or 304 fewer sales than the previous year. The number of sales has dropped off in each of the local markets. The biggest decline in sales happened in Ashburn zip code 20147 which had 60 fewer sales compared to last year (-60.6%) and Chantilly zip code 20152 with 36 fewer sales than last year (-67.9%).
Pending sales are down from last year in Loudoun County.
In November, there were 288 pending sales in the county, 179 fewer pending sales than a year ago, which is a 38.3% decrease. The number of pending sales fell the most in Ashburn zip code 20147 with 32 fewer pending sales than a year ago (-41.6%) followed by Sterling zip code 20164 with 28 fewer pending sales than the previous year (-49.1%).
Home prices continue to climb in the county’s housing market.
The median sales price in Loudoun County was $637,500 in November, a price increase of $37,550 compared to the same time last year (+6.3%). The biggest price jump took place in Leesburg zip code 20175, with the median sales price rising by $238,725, a 42.9% increase. The median price also grew in Lovettsville zip code 20180 (+21.1%) and Aldie zip code 20105 (+18.9%). The sales price in Chantilly zip code 20152 fell by double digits this month, with home prices down $72,000 (-10.3%).
Inventory is on the rise as active listings continue to grow.
There were 504 active listings in the Loudoun County market at the end of November, up 88.8% which is 237 more listings than a year ago. The largest increase in listings this month was in Sterling zip code 20164 with 53 more active listings than last November (+331.3%) and Leesburg zip code 20176 which had 51 additional listings (+268.4%).
Data Note: The housing market data for all jurisdictions in Virginia was re-benchmarked in November 2021. Please note that Market Indicator Reports released prior to November 2021 were produced using the prior data vintage and may not tie to reports that use the current data set for some metrics. We recommend using the current reports for historical comparative analysis.
*Provided by DAAR, Dulles Area Association of Realtors